High-level meta analysis of shear calibration
This shows a high-level meta-analysis using the output of various shear-calibration analyses
Standard imports
[1]:
import tables_io
import matplotlib.pyplot as plt
Set up the configuration
[2]:
DATADIR = "test_data"                                           # Input data directory
shear_value_strs = ['0p0025', '0p005', '0p01', '0p02', '0p04']  # Applied shears as a string
shear_values = [0.0025, 0.005, 0.01, 0.02, 0.04]                # Decimal versions of applied shear
cat_types = ['wmom', 'gauss', 'pgauss']                         # which object characterization to use
tracts = [10463, 10705]                                         # Tracts to loop over
clean = True                                                    # Fully clean patches for de-duplication

tract = tracts[0]
[3]:
#### Read the input data
[4]:
dd = {st:tables_io.read(f"{DATADIR}/meta_summary_{st}_{tract}.parq") for st in cat_types}
column_list None
column_list None
column_list None
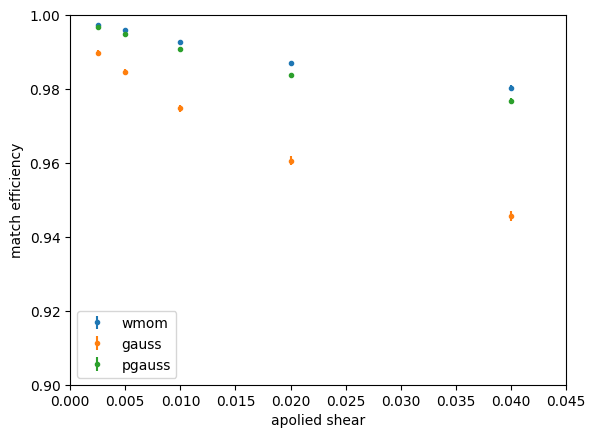
Plot the match efficiency
[5]:
for st, df in dd.items():
    _ = plt.errorbar(df.shear, df.efficiency, yerr=df.efficiency_err, marker=".", ls="", label=st)
_ = plt.legend()
_ = plt.ylabel('match efficiency')
_ = plt.xlabel('apolied shear')
_ = plt.ylim(0.90, 1.0)
_ = plt.xlim(0, 0.045)
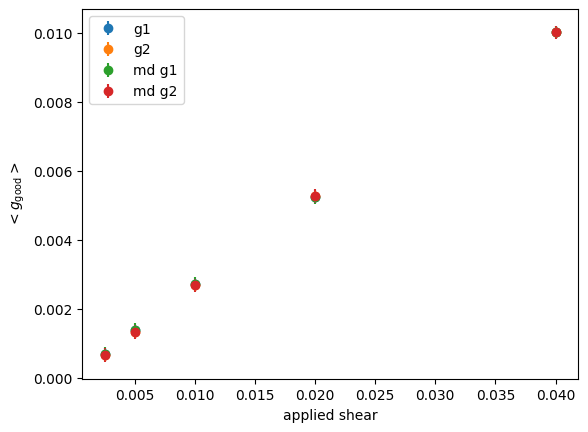
Make some other plots
Specifically:
The average response as a function of applied shear, comparing the per-object and ensemble estimates
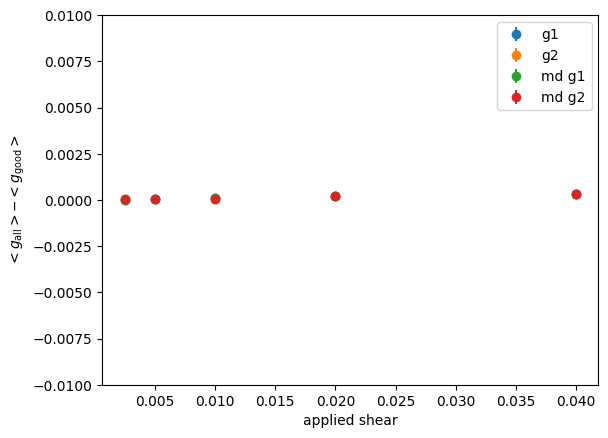
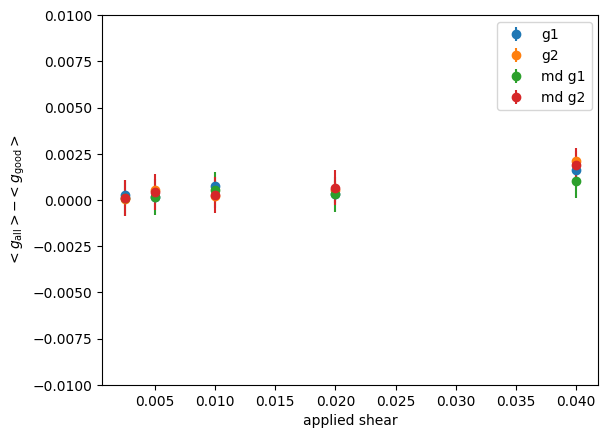
The difference between the response when only good clusters are considered v. when all clusters are considered
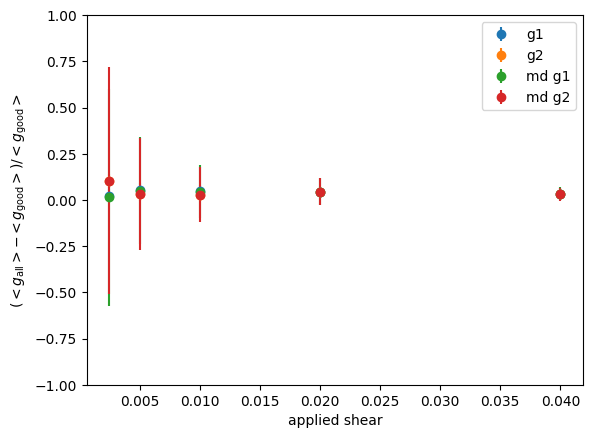
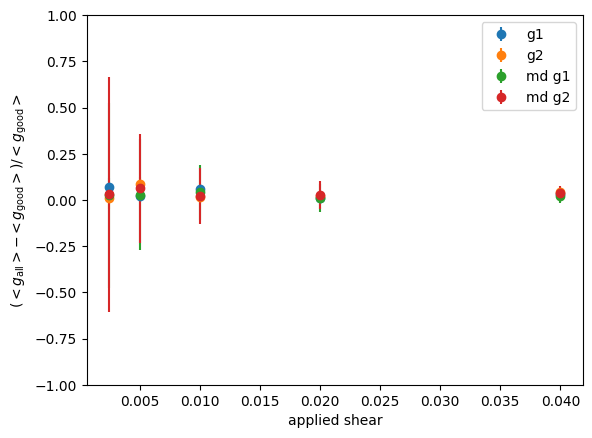
The relative difference between the response when only good clusters are considered v. when all clusters are considered
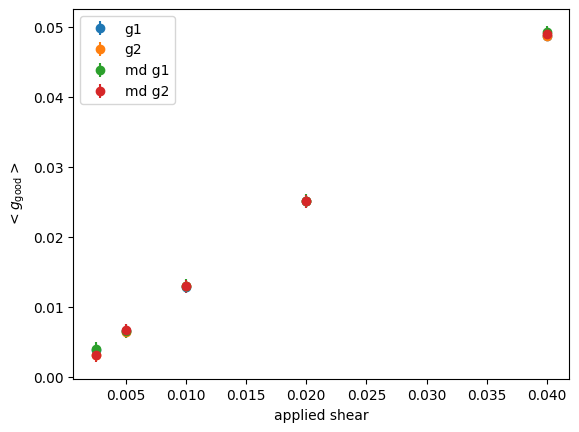
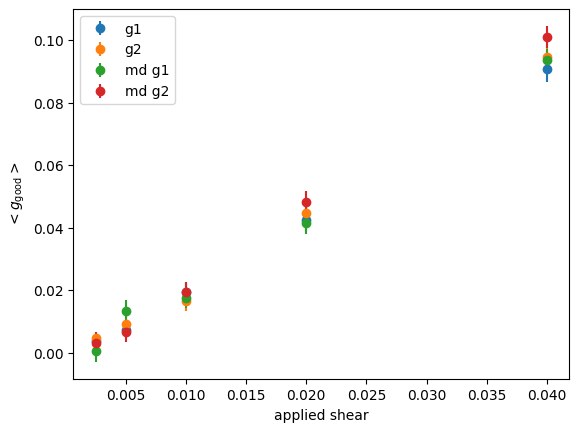
[6]:
def plotShear(df):
    _ = plt.errorbar(df.shear, df.mc_delta_g_1_1, yerr=df.mc_delta_g_1_1_err, marker="o", ls="", label="g1")
    _ = plt.errorbar(df.shear, df.mc_delta_g_2_2, yerr=df.mc_delta_g_2_2_err, marker="o", ls="", label="g2")
    _ = plt.errorbar(df.shear, 2*df.md_good_g_1_1, yerr=df.md_good_g_1_2_err, marker="o", ls="", label="md g1")
    _ = plt.errorbar(df.shear, 2*df.md_good_g_2_2, yerr=df.md_good_g_2_2_err, marker="o", ls="", label="md g2")
    _ = plt.xlabel("applied shear")
    _ = plt.ylabel(r"$<g_{\rm good}>$")
    _ = plt.legend()
[7]:
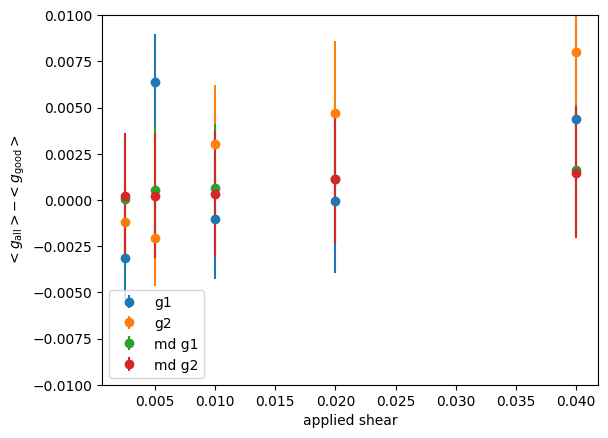
def plotDeltaShear(df):
    _ = plt.errorbar(df.shear, 2*df.md_all_g_1_1-df.mc_delta_g_1_1, yerr=df.mc_delta_g_1_1_err, marker="o", ls="", label="g1")
    _ = plt.errorbar(df.shear, 2*df.md_all_g_2_2-df.mc_delta_g_2_2, yerr=df.mc_delta_g_2_2_err, marker="o", ls="", label="g2")
    _ = plt.errorbar(df.shear, 2*df.md_all_g_1_1-2*df.md_good_g_1_1, yerr=df.md_good_g_1_1_err, marker="o", ls="", label="md g1")
    _ = plt.errorbar(df.shear, 2*df.md_all_g_2_2-2*df.md_good_g_2_2, yerr=df.md_good_g_2_2_err, marker="o", ls="", label="md g2")
    _ = plt.legend()
    _ = plt.xlabel("applied shear")
    _ = plt.ylabel(r"$<g_{\rm all}> - <g_{\rm good}>$")
    _ = plt.ylim(-0.01, 0.01)
[8]:
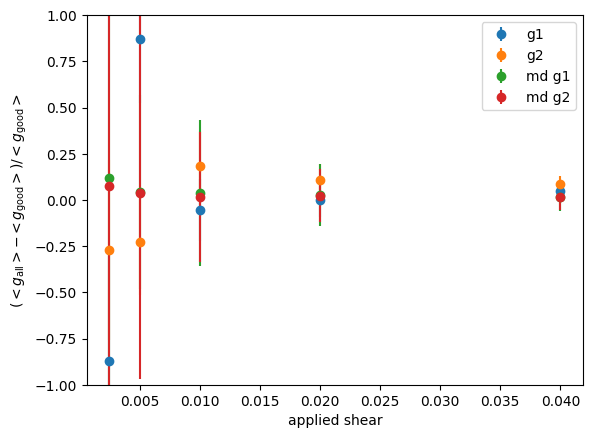
def plotRelDeltaShear(df):
    _ = plt.errorbar(df.shear, (2*df.md_all_g_1_1-df.mc_delta_g_1_1)/df.mc_delta_g_1_1, yerr=df.mc_delta_g_1_1_err/df.mc_delta_g_1_1, marker="o", ls="", label="g1")
    _ = plt.errorbar(df.shear, (2*df.md_all_g_2_2-df.mc_delta_g_2_2)/df.mc_delta_g_2_2, yerr=df.mc_delta_g_2_2_err/df.mc_delta_g_2_2, marker="o", ls="", label="g2")
    _ = plt.errorbar(df.shear, (2*df.md_all_g_1_1-2*df.md_good_g_1_1)/(2*df.md_good_g_1_1), yerr=df.md_good_g_1_1_err/df.md_good_g_1_1, marker="o", ls="", label="md g1")
    _ = plt.errorbar(df.shear, (2*df.md_all_g_2_2-2*df.md_good_g_2_2)/(2*df.md_good_g_2_2), yerr=df.md_good_g_2_2_err/df.md_good_g_2_2, marker="o", ls="", label="md g2")
    _ = plt.ylim(-1.0, 1.0)
    _ = plt.xlabel("applied shear")
    _ = plt.ylabel(r"$(<g_{\rm all}> - <g_{\rm good}>)/<g_{\rm good}>$")
    _ = plt.legend()
[9]:
plotShear(dd['wmom'])
[10]:
plotDeltaShear(dd['wmom'])
[11]:
plotRelDeltaShear(dd['wmom'])
[12]:
plotShear(dd['gauss'])
[13]:
plotDeltaShear(dd['gauss'])
[14]:
plotRelDeltaShear(dd['gauss'])
[15]:
plotShear(dd['pgauss'])
[16]:
plotDeltaShear(dd['pgauss'])
[17]:
plotRelDeltaShear(dd['pgauss'])
[ ]:
[ ]: