Reading shear data from an existing file
Standard imports
[1]:
import numpy as np
import matplotlib.pyplot as plt
import hpmcm
Set up the configuration
[2]:
shear_value_strs = ['0p0025', '0p005', '0p01', '0p02', '0p04']  # Applied shears as a string
shear_values = [0.0025, 0.005, 0.01, 0.02, 0.04]                # Decimal versions of applied shear
cat_types = ['wmom', 'gauss', 'pgauss']                         # which object characterization to use
tracts = [10463, 10705]                                         # Tracts to loop over
clean = True                                                    # Fully clean patches for de-duplication
[3]:
st = cat_types[0]
which_shear = 2
shear_st_ = shear_value_strs[which_shear]
shear = shear_values[which_shear]
tract = tracts[0]
Load the requested data
[4]:
dd = hpmcm.ShearData.load(f"test_data/shear_{st}_{shear_st_}_match_{tract}.pkl")
Make some plots
[5]:
_ = dd.makePlots(use_central=False)
---------------------------------------------------------------------------
AttributeError                            Traceback (most recent call last)
Cell In[5], line 1
----> 1 _ = dd.makePlots(use_central=False)

File ~/checkouts/readthedocs.org/user_builds/hpmcm/envs/latest/lib/python3.11/site-packages/hpmcm/shear_data.py:583, in ShearData.makePlots(self, use_central)
    580 def makePlots(self, *, use_central: bool = True) -> dict[str, Figure]:
    581     """Make the standard plots"""
    582     plot_dict = dict(
--> 583         metacalib=self.hists.plotMetacalib(
    584             self.stats.delta_g_1_1,
    585             self.stats.delta_g_2_2,
    586             shear=self.shear,
    587             use_central=use_central,
    588         ),
    589         metadetect_good=self.hists.plotMetaDetectGood(
    590             self.stats.good_g_1_1,
    591             self.stats.good_g_2_2,
    592             shear=self.shear,
    593             use_central=use_central,
    594         ),
    595         metadetect_bad=self.hists.plotMetaDetectBad(
    596             self.stats.bad_g_1_1,
    597             self.stats.bad_g_2_2,
    598             shear=self.shear,
    599             use_central=use_central,
    600         ),
    601         metadetect_all=self.hists.plotMetaDetectAll(
    602             self.stats.all_g_1_1,
    603             self.stats.all_g_2_2,
    604             shear=self.shear,
    605             use_central=use_central,
    606         ),
    607     )
    608     return plot_dict

File ~/checkouts/readthedocs.org/user_builds/hpmcm/envs/latest/lib/python3.11/site-packages/hpmcm/shear_data.py:224, in ShearHistograms.plotMetacalib(self, stats_g_1, stats_g_2, shear, use_central)
    222 else:
    223     val_slice = slice(0, len(self.good_delta_g_1_1))
--> 224     edge_slice = slice(0, len(self.bin_edges))
    226 axes.stairs(
    227     self.good_delta_g_1_1[val_slice],
    228     self.bin_edges[edge_slice],
    229     label=f"R_11: {stats_g_1.mean/shear:.4f} +- {stats_g_1.error/shear:.4f}",
    230 )
    231 axes.stairs(
    232     self.good_delta_g_2_2[val_slice],
    233     self.bin_edges[edge_slice],
    234     label=f"R_22: {stats_g_2.mean/shear:.4f} +- {stats_g_2.error/shear:.4f}",
    235 )

AttributeError: 'ShearHistograms' object has no attribute 'bin_edges'
[6]:
_ = dd.makePlots(useCentral=True)
---------------------------------------------------------------------------
TypeError                                 Traceback (most recent call last)
Cell In[6], line 1
----> 1 _ = dd.makePlots(useCentral=True)

TypeError: ShearData.makePlots() got an unexpected keyword argument 'useCentral'
[7]:
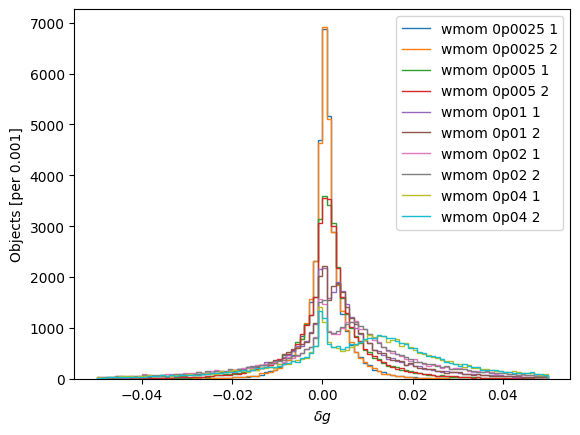
if st in ["pgauss"]:
    central = slice(9800,10200)
    centralEdges = slice(9800,10201)
elif st in ["wmom"]:
    central = slice(950,1050)
    centralEdges = slice(950,1051)
else:
    central = slice(800,1200)
    centralEdges = slice(800,1201)

for shear_st_ in shear_value_strs:
    dd = hpmcm.ShearData.load(f"test_data/shear_{st}_{shear_st_}_match_{tract}.pkl")
    #central = dd.hists.central
    #centralEdges = dd.hists.centralEdges
    binEdges = dd.hists.binEdges
    _ = plt.stairs(dd.hists.good_delta_g_1_1[central], binEdges[centralEdges], label=f"{st} {shear_st_} 1")
    _ = plt.stairs(dd.hists.good_delta_g_2_2[central], binEdges[centralEdges], label=f"{st} {shear_st_} 2")
    _ = plt.xlabel(r'$\delta g$')
    _ = plt.ylabel("Objects [per 0.001]")
_ = plt.legend()
[ ]: